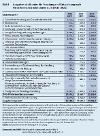
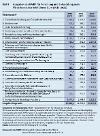
HTML versions of tables are barrier-free. PDF versions represent for layout reasons partly only current extract of specified time series, whereas in HTML and Excel entire time series are always shown.
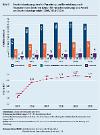
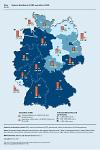
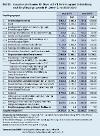
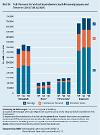
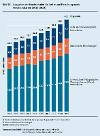
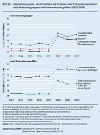
Fig. 3
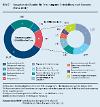
Bruttoinlandsausgaben für Forschung und Entwicklung nach finanzierenden Sektoren (Durchführungsbetrachtung) und Anteil am Bruttoinlandsprodukt (2005/2016-2020)
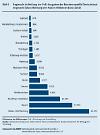
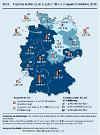
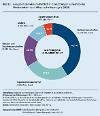
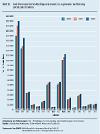
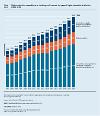
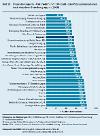
Regional distribution of R&D expenditure in the Federal Republic of Germany (implementation) and of government R&D expenditure by the Länder (financing)