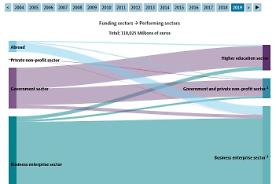
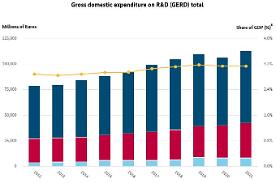
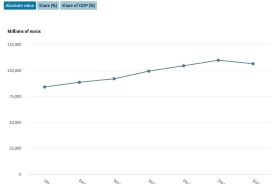
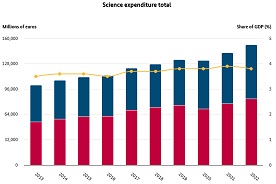
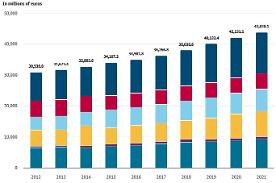
Graphic 1.1.1Gross domestic expenditure on R&D (GERD) of the Federal Republic of Germany, by performing sectorsmore
Graphic 1.1.1aGross domestic expenditure on R&D (GERD) of the Federal Republic of Germany, by performing sectorsmore
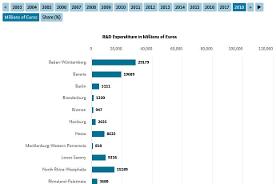
Graphic 1.1.3Regional distribution of R&D expenditure in the Federal Republic of Germany (implementation of R&D)more
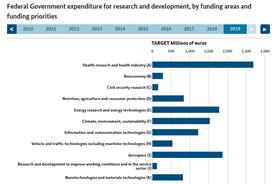
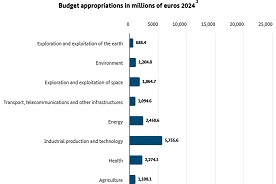
Graphic 1.1.5Federal Government expenditure for research and development, by funding areas and funding prioritiesmore
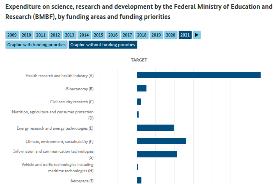
Graphic 1.1.6Expenditure on science, research and development by the Federal Ministry of Education and Research (BMBF), by funding areas and funding prioritiesmore
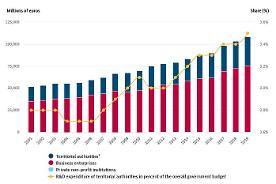
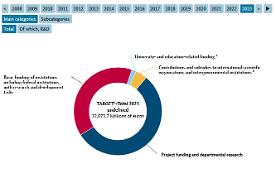
Graphic 1.1.7Federal Government expenditure on science, research and development, by types of fundingmore
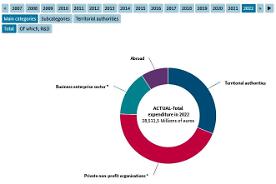
Graphic 1.1.8Federal Government expenditure on science, research and development, by recipient groupsmore
Graphic 1.1.11Regional distribution of R&D expenditure in the Federal Republic of Germany (implementation)more
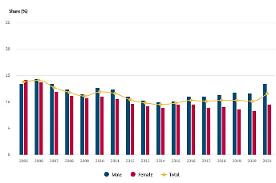
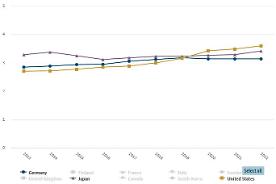
Graphic 1.3.1Share of gross domestic expenditure on research and development in GPD in selected countriesmore
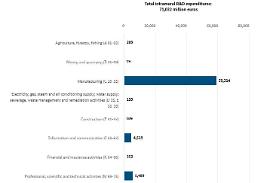
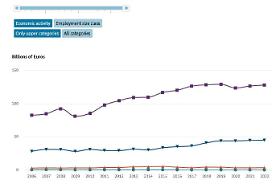
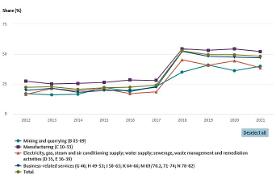
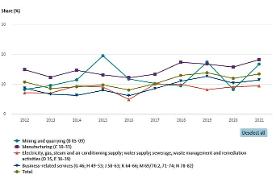
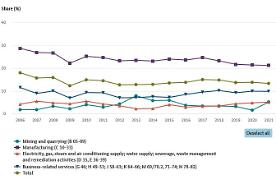
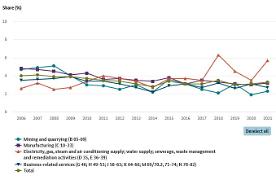
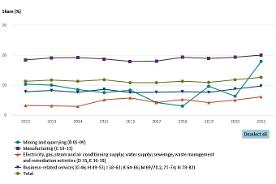
Graphic 1.5.1Intramural R&D expenditures of the business enterprise sector and the share of self-financed intramural R&D expenditures, by economic activitiesmore
Graphic 1.6.1Higher education expenditure on teaching and research, by types of higher education institutionmore
Graphic 1.7.2R&D personnel, by sex, sectors of employment and personnel groups, based on full-time equivalentsmore
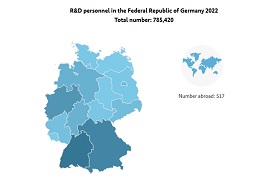
Graphic 1.7.3Regional breakdown of R&D personnel in the Federal Republic of Germany (full-time equivalents)more
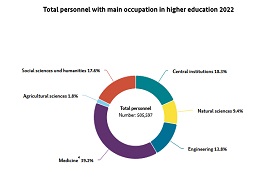
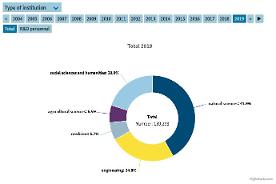
Graphic 1.7.6Personnel of higher education institutions, by fields of science (full-time equivalents)more
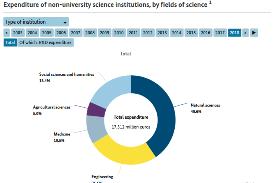
Graphic 1.7.9Personnel of non-university science institutions by type of institution and fields of science (full-time equivalents)more
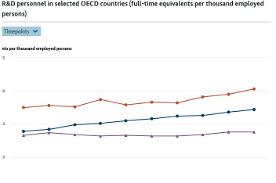
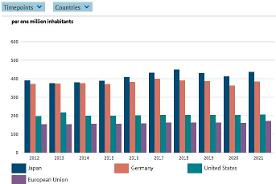
Graphic 1.7.11R&D personnel in selected OECD countries (full-time equivalents per thousand employed persons)more
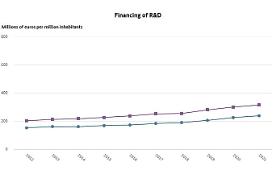
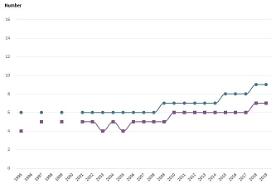
Graphic 1.7.13Regional breakdown of R&D personnel in the Federal Republic of Germany per 1,000 inhabitantsmore
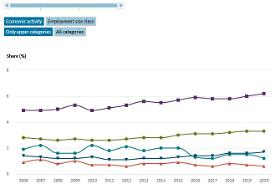
Graphic 1.8.13Product innovation rate with market innovations, by sector groups and employment size classesmore
Graphic 1.8.16Process innovation rate with cost reduction, by sector groups and employment size classesmore
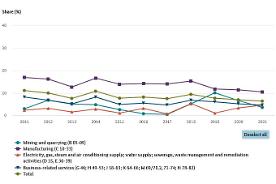
Graphic 1.8.19Share of revenue from product innovations as a percentage of total revenue, by sector groups and employment size classesmore
Graphic 1.8.23Share of cost reduction through process innovations, by sector groups and employment size classesmore
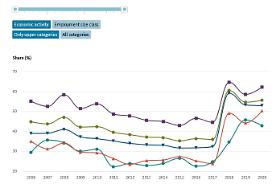
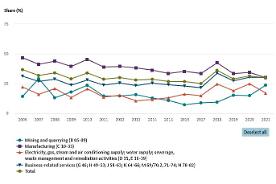
Graphic 1.8.25Share of companies continuously engaged in research and development, by sector groups and employment size classesmore
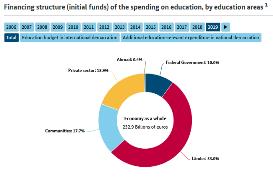
Graphic 1.9.2bFinancing structure (original source of funds) of the spending on education, by education areasmore
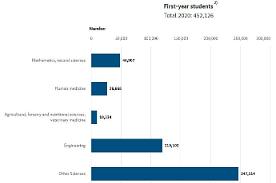
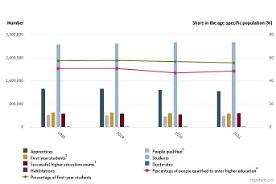
Graphic 1.9.4/1.9.5First-year students and First-time graduates, total and percentage of the age-specific population in Germany, by subject groups and study areas (in international demarcation)more
Graphic 1.9.6Basic data of the educational system (educational participation in national demarcation)more
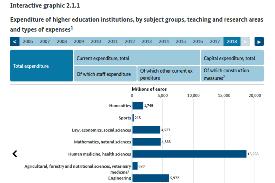
Graphic 2.1.1Expenditure of higher education institutions, by subject groups, teaching and research areas and types of expensesmore
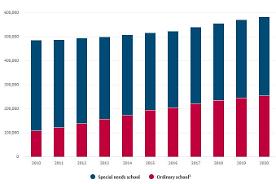
Graphic 2.3.13Pupils with special educational needs on special needs schools and ordinary schools, by support focussesmore
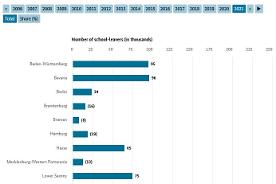
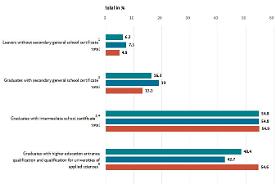
Graphic 2.3.16School graduates and school leavers, by type of degree as a percentage of the same-age populationmore
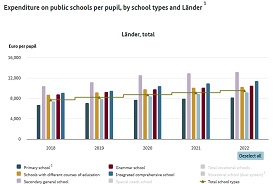
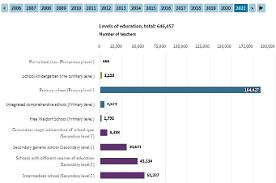
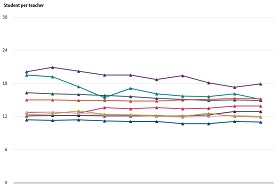
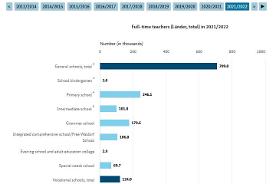
Graphic 2.3.25Student-teacher ratio at general schools, by levels of education, school types and Ländermore
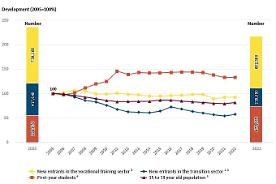
Graphic 2.3.43Transition from school to post-school careers - development of new entrants in selected iABE-sectors and first-year studentsmore
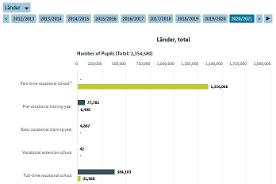
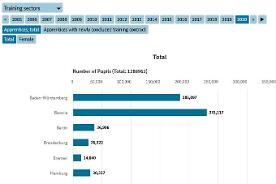
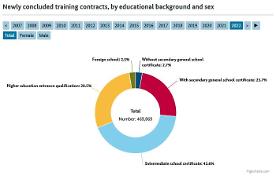
Graphic 2.4.17Total apprentices and apprentices with newly concluded training contracts by training sectors, sex and Ländermore
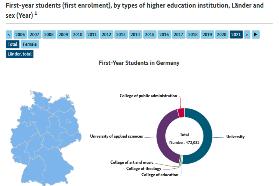
Graphic 2.5.7First-year students (first enrolment), by types of higher education institution, Länder and sex (Year)more
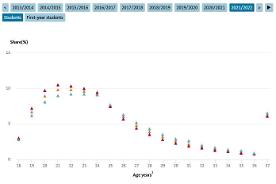
Graphic 2.5.20German students and first-year students (first enrolment), by age, types of higher education institution and sexmore
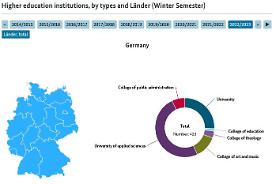
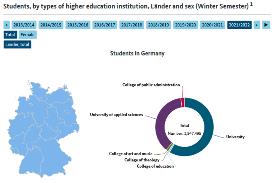
Graphic 2.5.22Students, by types of higher education institution, Länder and sex (Winter Semester)more
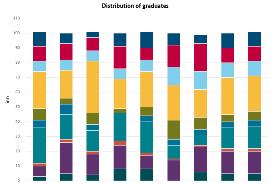
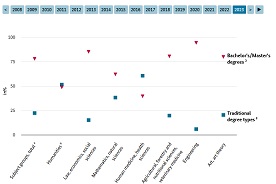
Graphic 2.5.46Comparison of traditional degree types with Bachelor's/Master's degrees of higher education graduates, by subject groupsmore
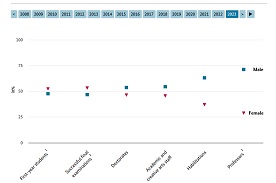
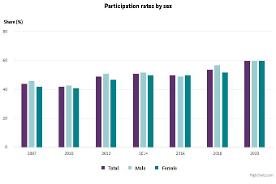
Graphic 2.5.83Share of males and females in various status and degree groups in the field of higher educationmore
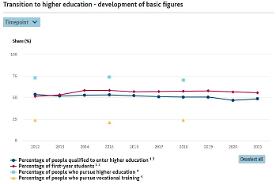
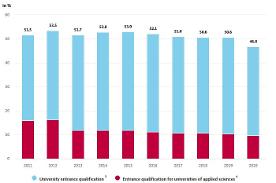
Graphic 2.5.85Percentage of people qualified to enter higher education of the age-specific population, by types of qualificationmore
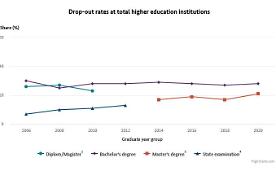
Graphic 2.5.90Drop-out rates of German first-degree students, by types of higher education institution and selected degree typesmore
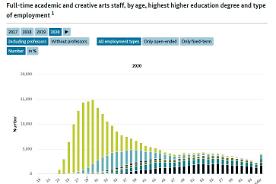
Graphic 2.5.112Academic and creative arts personnel in main occupation, by age, highest higher education degree and type of employmentmore
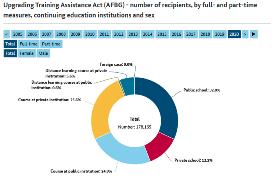
Graphic 2.6.8Upgrading Training Assistance Act (AFBG) - number of recipients, by full- and part-time measures, continuing education institutions and sexmore